

My site has recently been plagued by performance issues and I spent a lot of time trying to figure out the cause as well as optimizing it so it would perform much better. It was pretty bad and pages were taking 8-12 seconds to load on average. As a former server admin my natural instinct was to immediately blame the hardware platform that my site was running on. In my case I run WordPress hosted by InMotion Hosting so I started by calling them and blaming them for my slow hosting.
They had me run some external tests and from those the underlying causes were uncovered (it wasn’t a server issue). Having eliminated the hosting platform as the cause I did a bunch of research and tried a lot of optimization plug-ins and methods in an effort to speed up the site. When I was done the combination of everything I had done had sped up the site considerably to the point that I am now happy with my overall performance.
Now that I am past that I thought I would pass on some lessons learned to help other who sites might not be optimized properly which can cause your blog visitor experience to suffer not to mention impact how google searches your site. Google has stated that PageSpeed, which is a measurement that they use when ranking search results will directly impact how your site is ranked when user search for content. They have measurements for both mobile and desktop page load times, the slower your site takes to load, the worse you end up in their rankings. So having a site that is well optimized is very beneficial to both your visitors and to your visibility on the internet.
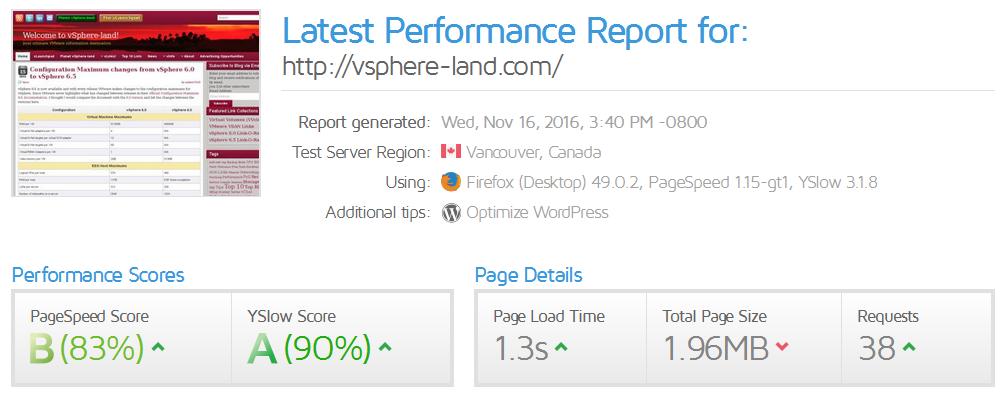
So let’s start on how to analyze your site, I mainly used one online tool for that which is a site called GTmetrix. All you do is go to their site, put in your blog URL and they run a variety of tests on it and generate a report.that has detailed scores, benchmarks, timings and recommendations. They run your site through both Google PageSpeed testing and YSlow testing so your site is analyzed from 2 different perspectives. The results can point you in the right direction of what to fix and the recommendations they provide can tell you how to do it. When you run a report make sure you click on the Waterfall tab to see the load times for all your website elements.
My site was initially scoring as an F grade by both PageSpeed and YSlow, so I had a lot of work to do, below are the various things I did to bring that score up an A & B grade.
 Implement a caching plug-in
I went with W3 Total Cache which has excellent reviews, it’s fairly easy to install but there are a lot of knobs you have to turn to configure it optimally, here is a guide to get it set properly although every site may vary.
Implement CDN caching
Having a content delivery network (CDN) cache your content for you can help your site perform considerably faster as they deliver content from CDN servers across the world instead of from your site. CDN servers are typically closer geographically to visitors and can serve content more efficiently. W3 Total Cache can work together with a CDN to provide the best possible site performance. I signed up for a free CloudFlare CDN account, updated my DNS nameservers to point to the CloudFlare nameservers and then configured the CloudFlare extension inside the W3 Total Cache Plugin. All in in it wasn’t that difficult and you can read how to do it here.
Optimize your database
Your WordPress MySQL database can accumulate a lot of remnants and junk over time, so the best way to clean it up is to use a plug-in that will scan all your tables and make clean-up recommendations that you can execute. I first disabled revisions on my site as the more you edit a doc (which I do frequently on my link pages) you will create more revisions of it that fill up your database. I used the Advanced Database Cleaner plug-in which did the job nicely, be sure and backup your database first using a plug-in or through your provider.
Modify ajax heartbeats
Disabling or limiting ajax heartbeats is recommended to improve performance, here is a good article on how to do that with a plug-in. In my case the admin-ajax.php was causing a lot of delay in load times which was mostly caused by a plug-in (still trying to fix that). I identified that in the Waterfall tab in the GTMetrix report, there was a GET to admin-ajax.php that was taking 6-7 seconds to complete.
Optimize your images
I tend to use a lot of images in my content and unless you optimize them properly it can really slow your site down as non-optimized images can take much longer time to load. I initially looked at the WP Smush plug-in but ended up going with the EWWW Image Optimizer plug-in instead. It will run though all your existing images and optimize them and reduce their total size which will reduce their load time.
Force browser caching
I inserted some code into my .htaccess file to force browser caching, you can read how to do that here.
Investigate your plug-ins
Plug-ins can frequently be the cause of slow performance but unfortunately there isn’t any easy way to determine which one is at fault. There is a plug-in called P3 Performance Profiler that GoDaddy created for WordPress to analyze plug-in performance but unfortunately it hasn’t been updated in over 2 years and does not work with the latest versions of WordPress so avoid it. If you look the GTMetrix Waterfall results you might be able to identify a slow plug-in but if you suspect a plug-in is causing performance issues the easiest way to identify which one is to disable them one at a time and run a new GTMetrix scan afterwards to see if your site performance improves. Once you know which plug-in is causing it go talk to the developer or switch to a different plug-in that offers the same functionality.
How did the Top vBlogs score?
So once I had my site optimized I was curious as to how other Top vBlogs were performing so I ran the top 10 through GTMetrix and below are the results. Hats off to Chris Wahl and Scott Lowe whose sites are blazing fast, Alan Renouf’s site was generating 404 errors in the analysis so I skipped it and included Chad Sakac instead. I encourage other bloggers to test out their site as well, see how you score and let me know in the comments, also let me know what you did to improve it and hopefully what I posted here helped you out.
Site URL PageSpeed Score YSlow Score Page Load Time Total Page Size Requests
http://www.yellow-bricks.com/ C (79%) E (51%) 3.5s .97MB 57
http://www.virtuallyghetto.com/ B (84%) D (62%) 6.5s 879KB 77
http://cormachogan.com/ B (83%) D (61%) 3.4s 940KB 79
http://www.frankdenneman.nl/ C (75%) D (66%) 4.7s 1.05MB 58
http://wahlnetwork.com/ A (96%) B (86%) 1.7s 368KB 40
http://www.vladan.fr/ C (75%) E (57%) 5.2s 1.53MB 130
http://blog.scottlowe.org/ A (96%) B (87%) 0.8s 190KB 11
http://www.ntpro.nl/blog/ F (35%) E (58%) 3.6s 1.28MB 35
http://www.derekseaman.com/ C (77%) E (54%) 8.4s 1.14MB 124
http://virtualgeek.typepad.com/ D (63%) D (67%) 6.6s 6.35MB 70