Today I wanted to highlight another white paper that I wrote for SolarWinds that is titled “Storage I/O Bottlenecks in a Virtual Environment”. I enjoyed writing this one the most as it digs really deep into the technical aspects of storage I/O bottlenecks. This white paper covers topics such as the effects of storage I/O bottlenecks, common causes, how to identify them and how to solve them. Below is an excerpt from this white paper, you can register and read the full paper over at SolarWinds website.
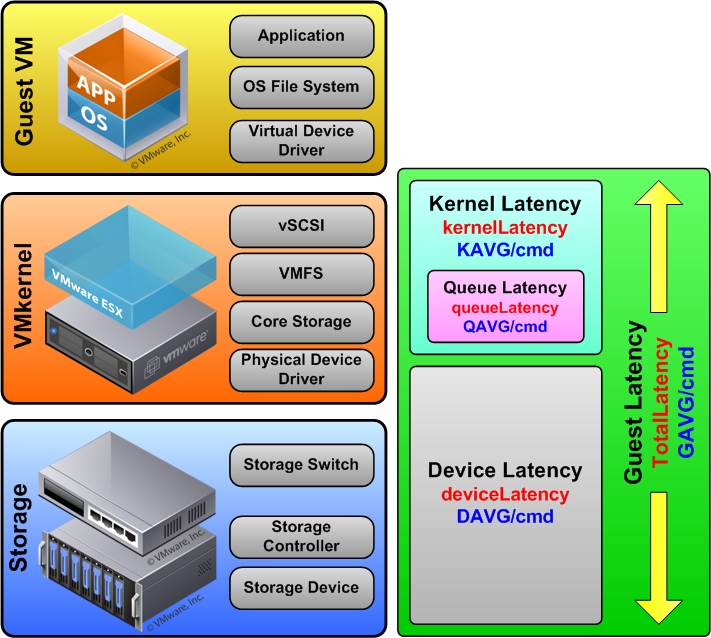
There are several key statistics that should be monitored on your storage subsystem related to bottlenecks but perhaps the most important is latency. Disk latency is defined as the time it takes for the selected disk sector to be positioned under the drive head so it can be read or written to. Once a VM makes a read or write to its virtual disk that request must follow a path to make its way from the guest OS to the physical storage device. A bottleneck can occur at different points along that path, there are different statistics that can be used to help pinpoint where the bottleneck is occurring in the path. The below figure illustrates the path that data takes to get from the VM to the storage device.

The storage I/O goes through the operating system as it normally would and makes its way to the device driver for the virtual storage adapter. From there it goes through the Virtual Machine Monitor (VMM) of the hypervisor which emulates the virtual storage adapter that the guest sees. It travels through the VMkernel and through a series of queues before it gets to the device driver for the physical storage adapter that is in the host. For shared storage it continues out the host on the storage network and makes its way to its final destination which is the physical storage device. Total guest latency is measured at the point where the storage I/O enters the VMkernel up to the point where it arrives at the physical storage device.
The total guest latency (GAVG/cmd as it is referred to in the esxtop utility) is measured in milliseconds and consists of the combined values of kernel latency (KAVG/cmd) plus device latency (DAVG/cmd). The kernel latency includes all the time that I/O spends in the VMkernel before it exits to the destination storage device. Queue latency (QAVG/cmd) is a part of the kernel latency but also measured independently. The device latency is the total amount of time that I/O spends in the VMkernel physical driver code and the physical storage device. So when I/O leaves the VMkernel and goes to the storage device this is the amount of time that it takes to get there and return. A guest latency value that is too high is a pretty clear indication that you have a storage I/O bottleneck that can cause severe performance issues. Once total guest latency exceeds 20ms you will notice the performance of your VMs suffer, as it approaches 50ms your VMs will become unresponsive.
Full paper including information on the key statistics related to storage I/O bottlenecks available here…


